Grafana Loki Tutorial
As far as some of us here are running several cardano nodes, at some point it might happen that we might need to go through some cardano node logs, maybe it is relay what misbehaves or maybe you missed a block and now you need to find out what happened. I personally used to go through logs with tail, grep and etc. That doesn’t seems very productive way. How you can filter all logs from all nodes for 12:00-12:05 UTC 5th of May for example? You can of course grep it on several machines and then piece them together, but what if you can have a central location were all logs are stored and you can search through all logs from all nodes simultaneously or on particular box only or on several particular boxes and even create alerts based on particular log entry using regexp and etc.
So here I would like to explain how I personally build centralized log solutions for all my cardano-nodes. I used for that grafana loki, what will receive logs and then you can see them in grafana. As far as grafana is widely used by SPOs, I think it a reasonable choice, you don’t need to add much to your existing infrastructure.
1. Loki installation
I personally installed Grafana & prometheus some time ago using docker-compose, so to install Loki I just needed to update docker-compose file accordingly.
Grafana-prometheus-loki docker-compose files what I personally use for Grafana, Loki and Prometheus can be found here:
If you are starting without existing grafana, or you want to use docker now, you can just run 5 following commands(assuming we are using debian based Linux distro) and you will have new and shiny grafana, prometheus and loki running in docker:
apt-get update && apt-get upgrade -y && apt-get install docker-compose -y
mkdir /docker && cd /docker
git clone https://github.com/os11k/grafana-loki-prometheus.git
cd ./grafana-with-prometheus/
docker-compose up -d --build
Don’t forget to update accordingly to your setup ./etc-prometheus/prometheus.yml.
If you are here just for Loki, you need to update docker-compose.yml and comment out all parts related to grafana & prometheus:
version: "3.5"

services:
#  grafana:
#    container_name: grafana
#    network_mode: "host"
#    image: grafana/grafana:latest
#    restart: always
#    volumes:
#      - grafana_data:/var/lib/grafana
#    logging:
#      driver: "json-file"
#      options:
#        max-size: "200k"
#        max-file: "10"
#  prometheus:
#    container_name: prometheus
#    network_mode: "host"
#    image: prom/prometheus:latest
#    restart: always
#    volumes:
#      - ./etc-prometheus:/etc/prometheus
#      - prometheus_data:/prometheus
#    logging:
#      driver: "json-file"
#      options:
#        max-size: "200k"
#        max-file: "10"
  loki:
    container_name: loki
    network_mode: "host"
    image: grafana/loki:latest
    restart: always
    volumes:
      - ./etc-loki:/etc/loki
      - loki_data:/loki
    command: -config.file=/etc/loki/loki-config.yml
    logging:
      driver: "json-file"
      options:
        max-size: "200k"
        max-file: "10"
volumes:
#    prometheus_data: {}
#    grafana_data: {}
    loki_data: {}
There are some other ways to install Loki, but I personally would avoid that:
Installing Loki on Ubuntu 20.04
2. Installing and configuring agent for pushing logs to Loki
When Loki installed, you need to configure your nodes to push logs to Loki. In case if your cardano nodes are running in docker, you just need to install docker module and restart docker engine
docker plugin install grafana/loki-docker-driver:latest --alias loki --grant-all-permissions
systemctl restart docker
you can verify that everything is fine:
docker plugin ls
And you should see your newly installed plugin for docker:
ID             NAME          DESCRIPTION           ENABLED
b20ef946c02f   loki:latest   Loki Logging Driver   true
Then you can either to configure each container separately, for example I just added those lines in my docker-compose(don’t forget to put your Loki IP instead of loki-ip):
    logging:
      driver: loki
      options:
        loki-url: http://loki-ip:3100/loki/api/v1/push
        max-size: 50m
Or you can configure it once for all containers by creating /etc/docker/daemon.json file(again do not forget to change loki-ip to IP address of your Loki box):
{
    "debug" : true,
    "log-driver": "loki",
    "log-opts": {
        "loki-url": "https://loki-ip/loki/api/v1/push",
        "max-size": "50m"
    }
}
If you created or edited daemon.json, then you will need to restart docker service:
systemctl restart docker
max-size setting seems weird, but you need to have it, otherwise loki docker plugin will fill out all the space.
Keep in mind that containers must be recreated so they can start sending logs to Loki. As far as I utilize docker-compose, that what worked for me:
docker-compose down
docker-compose up -d --build
More details:
Collecting Docker Logs With Loki
If you are running your nodes not in docker then you will need to install promtail - a client which will push logs to Loki:
Install Promtail on Ubuntu 20.04
You will need to configure promtail too, here is simple config file, what should work(never tried, though):
server:
  http_listen_port: 0
  grpc_listen_port: 0

positions:
  filename: /tmp/positions.yaml

client:
  url: http://localhost:3100/api/prom/push

scrape_configs:
- job_name: system
  entry_parser: raw
  static_configs:
  - targets:
      - localhost
    labels:
      job: varlogs
      __path__: /var/log
Keep in mind that you must put correct Loki IP, in above example it is localhost, additionally you need to change directory where cardano-node logs are stored, in example above it is /var/log, so if your cardano node logs goes in different directory, you need to update it.
Config file was taken from here
Loki do not pull logs, but rather promtail or docker engine are pushing logs to Loki. So if you are using default 9100 port for Loki, then from clients(cardano nodes in our case) you should be able to access Loki on 9100 port. You can check that with telnet command from cardano nodes:
telnet loki-ip 9100
In case of successful connection you should see something like that:
Connected to loki-ip.
Escape character is '^]'.
3. Configuring Loki datasource in Grafana
When Loki is installed and Loki client is configured(docker driver or promtail) you should add Loki as source to Grafana, it is same process as you did for prometheus:
Configuration => Datasources:

Press add data source and then select Loki from list:
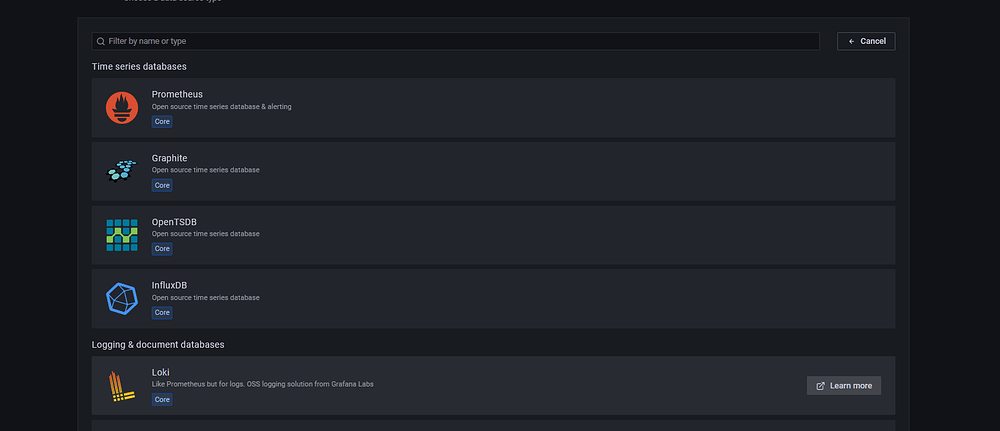
You will see following screen:
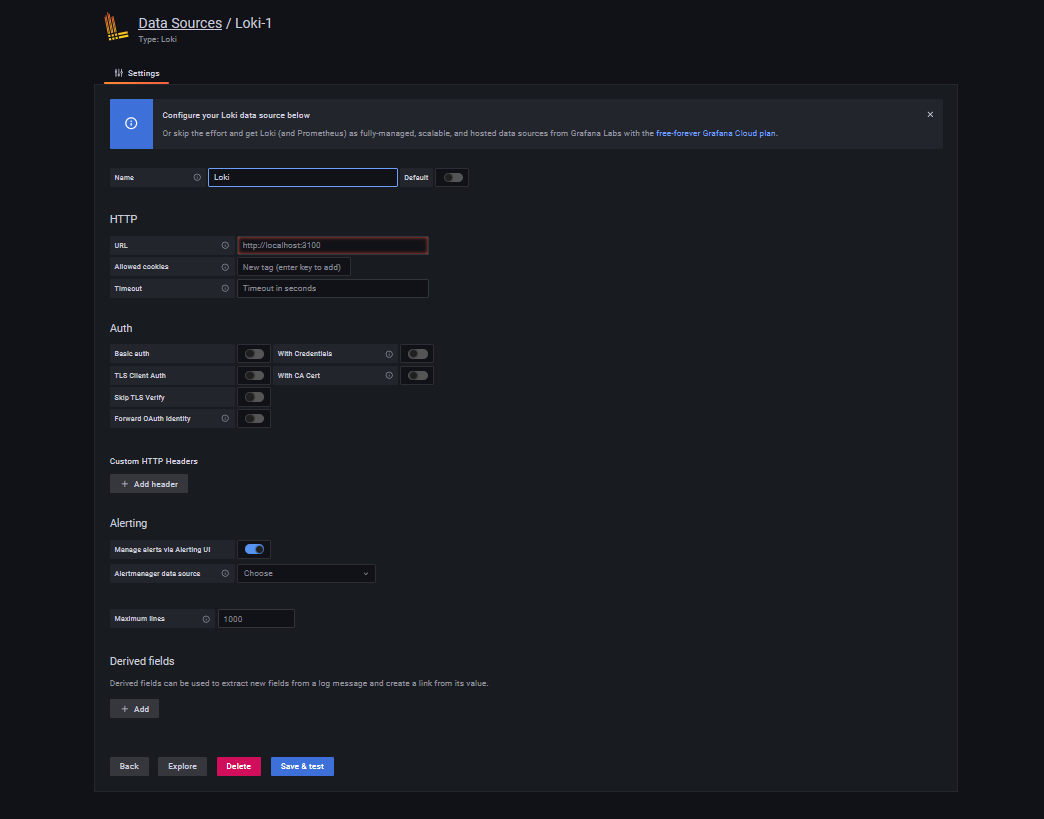
If you are running Loki on same box as Grafana or in docker as I described above, you will need just to put localhost in URL, as it proposes:
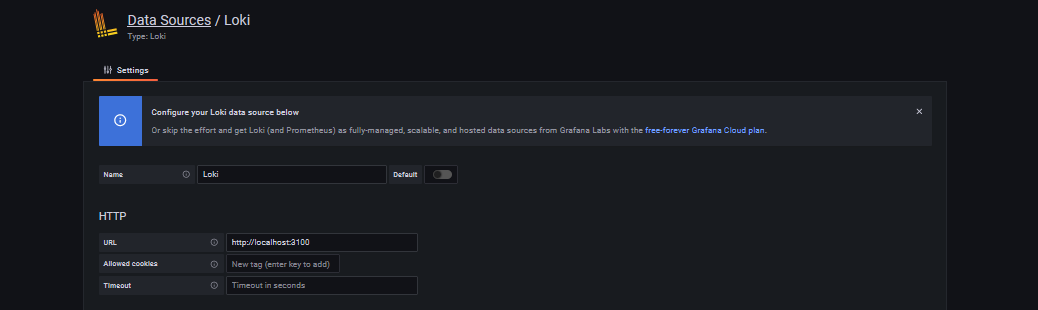
If you run Loki on different server, then those link should be updated accordingly.
4. Setting up Loki dashboards
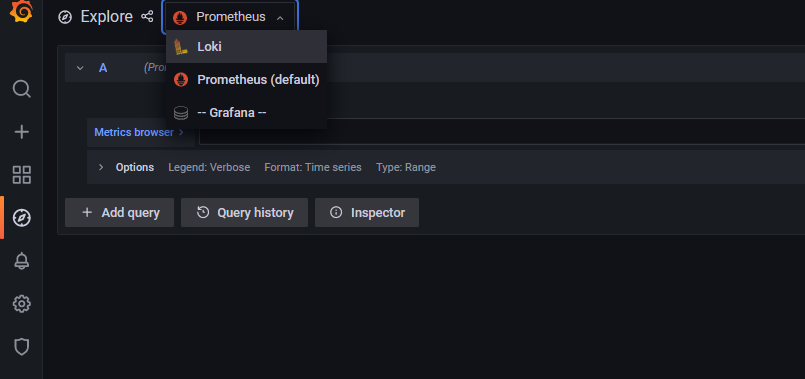
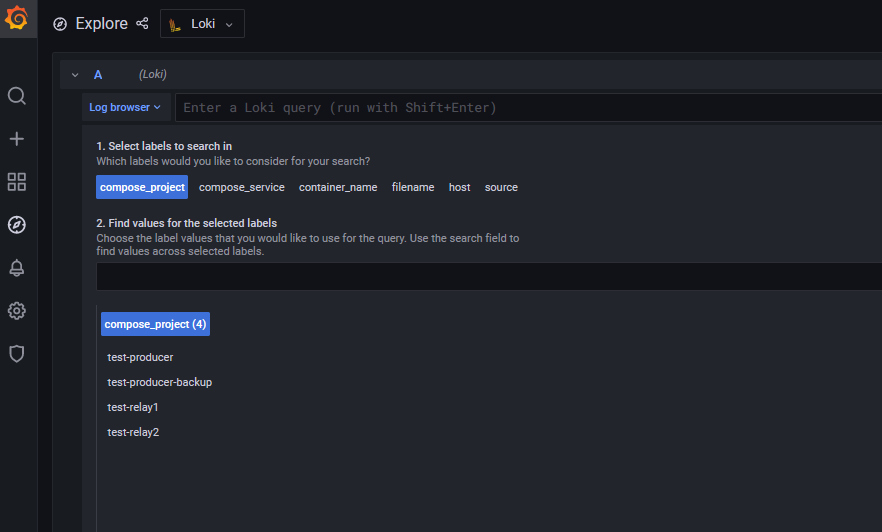
Now we are ready to browse Loki data in grafana. Go to explore:

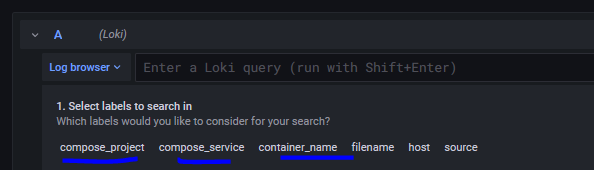
Select Loki:
There you should be able to see different labels. In my case it is compose_projects and others, compose_projects are my docker container names, with promtail it can be configured inside config file I believe, but in any case you must have something there.
If we select specific label in our case compose_project => test-relay1
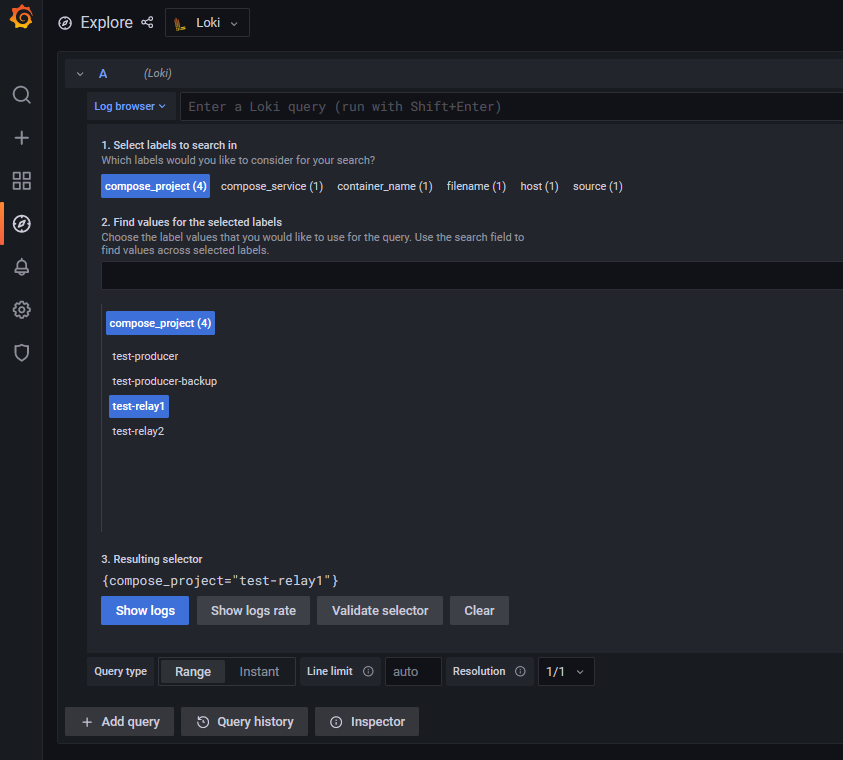
If we press show logs, you should be able to see all logs from that box:
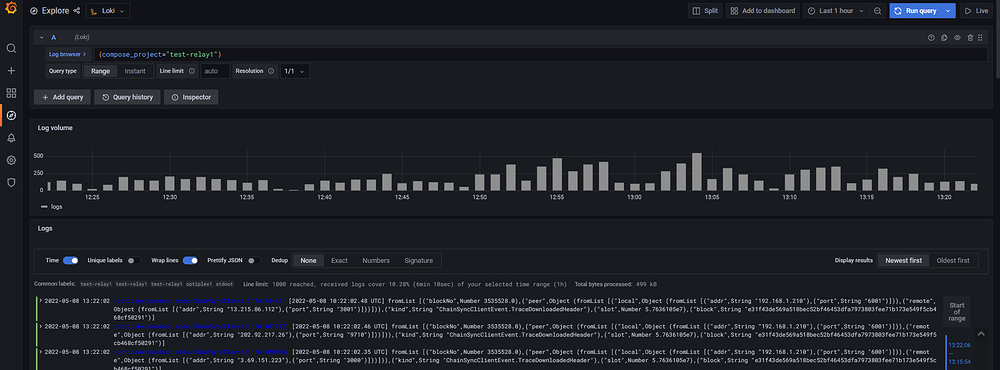
This is how you can access all your logs in “explore” menu, if you like you can add that screen of logs to dashboard, if you press “add to dashboard” button on right top corner:
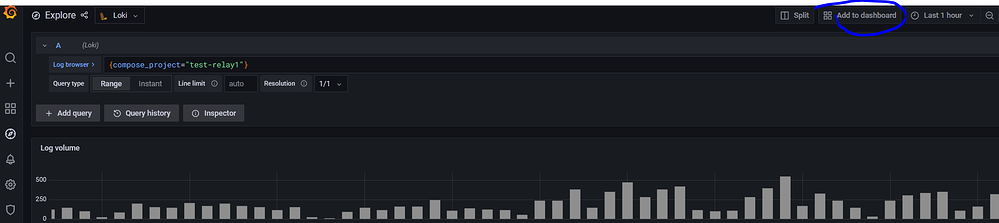
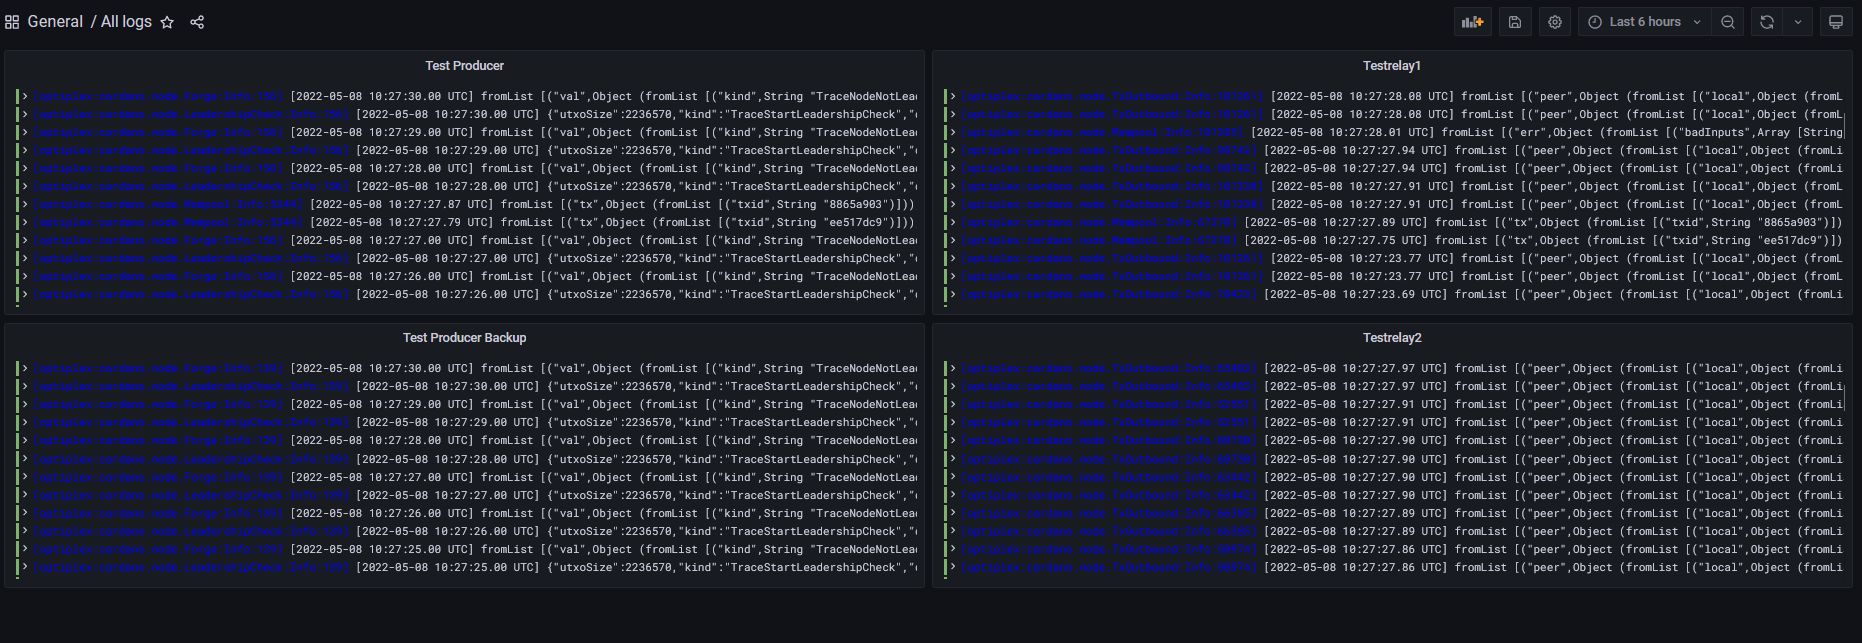
I personally created one dashboard with 4 panels with logs from all my nodes, as shown here:
To search in all logs simultaneously you can do it via “explore” or you can add following dashboard to your grafana:
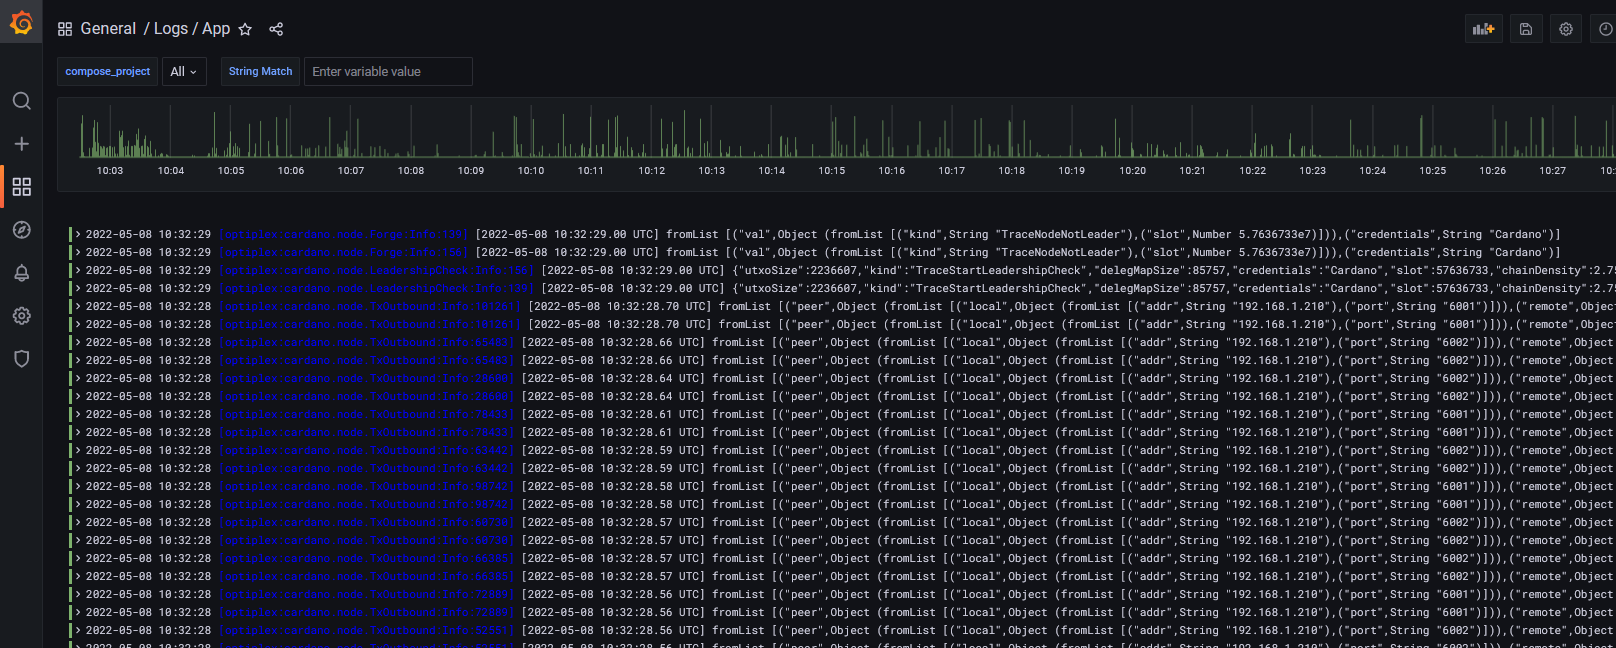
Keep in mind in my example dashboard cardano nodes has label named “compose_project”, so if your nodes has different labels inside loki just substitute in above file word “compose_project” with correct one. Your labels you can find in “explore” of grafana like here:
At the end you should be able to have following dashboard:
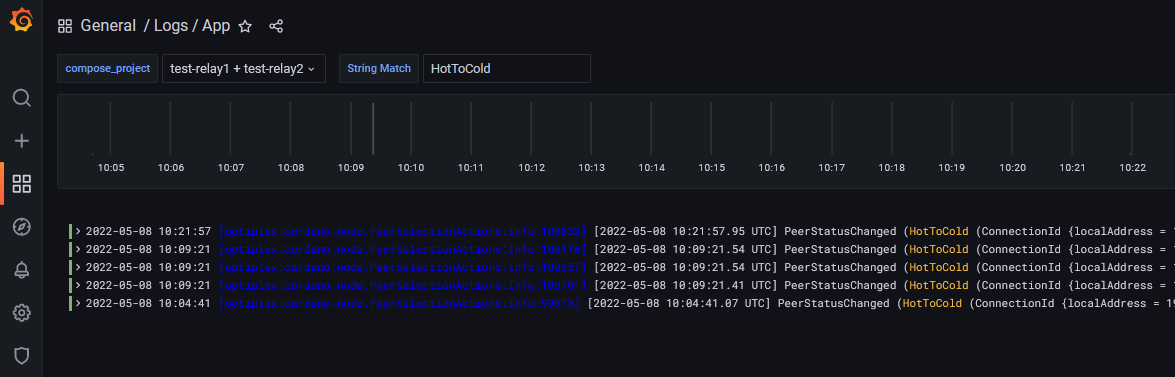
In “compose_project” you can select nodes where you can search for logs and String match field is what you are looking for. For example I have p2p on my test pool, let search on relays, when peer status changed from Hot to Cold:
So that seems pretty nice working and no need to go login via SSH to your nodes and go through logs.
I would like to add that currently latest(8.5+ and 9+) versions of Grafana has very nice alerting out of the box, so called unified alerting. So if any of you are using some old Grafana versions, it is worth to consider to move to new version and maybe even a docker based Grafana, what will allow you to send alerts to telegram, slack and etc, without need alert manager and if you will choice docker then updates of Grafana will become much easier.
Recommended resources:
How To Forward Logs to Grafana Loki using Promtail